Microsoft Dynamics 365 Business Central can hold an enormous amount of valuable business information.
But simply having that data isn't enough.
Finance teams, sales teams, operations managers and business leaders need to be able to understand what the information is telling them without spending hours extracting figures into spreadsheets, combining reports or waiting until month end.
That’s where Microsoft Power BI and Business Central can work particularly well together.
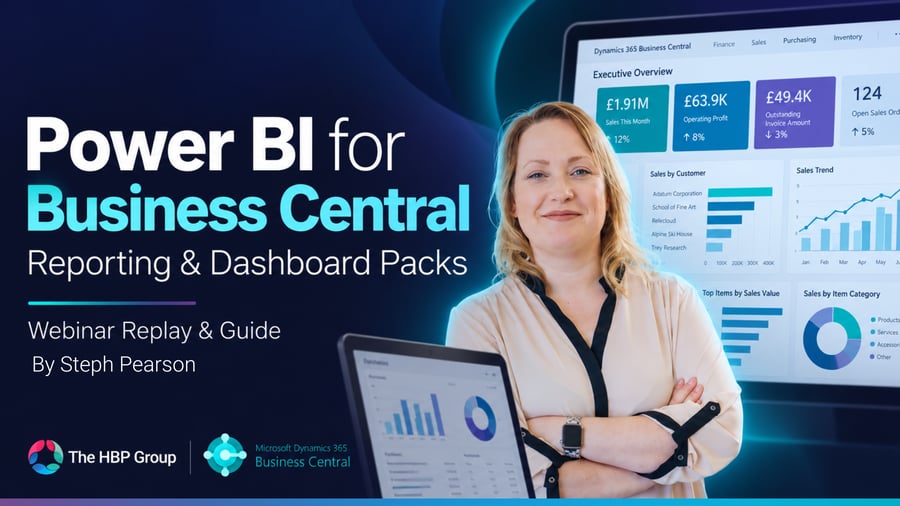
In our recent webinar, we explored how organisations can connect the information already held within Business Central to interactive Power BI reports and dashboards, giving users a clearer view of everything from revenue and cash flow to stock, sales performance, projects and sustainability.
You can watch the full webinar below or continue reading for our complete guide to Power BI reporting for Business Central.
What we'll cover
-
What is Power BI for Business Central?
-
Why reporting directly from your ERP matters
-
How Power BI connects with Business Central
-
How users access Power BI reports
-
Financial reporting and KPI dashboards
-
Sales reporting and customer analysis
-
Inventory and operational reporting
-
Project and forecasting insight
-
Sustainability reporting
-
Sharing Power BI reports across your organisation
-
Security and governance
-
Alerts, monitoring and automated insights
-
Do you need to build Power BI reports yourself?
-
Frequently asked questions
What is Power BI for Business Central?
Power BI is Microsoft's business intelligence and analytics platform.
When connected with Microsoft Dynamics 365 Business Central, it allows businesses to take the operational and financial information held inside their ERP system and turn it into interactive reports, visualisations and dashboards.
The objective isn't simply to create prettier versions of existing reports.
It's to make information easier to understand and enable people across finance, sales and operations to make better-informed decisions.
For example, rather than running several separate reports to understand revenue, margin, cash position and inventory, a management team can bring those measures together in one dashboard.
They can start with a high-level view of performance and, where necessary, drill directly into the numbers underneath it.
That distinction is important.
Business Central remains the source of the business information. Power BI helps people consume and understand that information.
Why is reporting from Business Central so important?
Many organisations still spend a significant amount of time taking information out of their ERP system and putting it into spreadsheets.
The ERP may already contain the organisation's trusted financial and operational data, but people then export that information elsewhere simply to analyse it.
The problem usually isn't a lack of data.
It's turning that data into something useful.
Business leaders may want to know:
Are revenues moving in the right direction?
Which customers are generating the strongest margins?
How healthy is our cash position?
Where do we have too much or too little stock?
Are salespeople achieving their targets?
How are actual results comparing with budget?
Which areas of the business need attention?
Traditional reporting can answer these questions, but it can sometimes require several different reports and a considerable amount of manipulation before someone gets to the answer they actually need.
Power BI changes that experience.
Instead of simply reporting what happened last month, organisations can have greater visibility of what is happening now and identify areas that may need attention.
That makes reporting much more operational.
It can become something people use during the working day rather than something produced retrospectively for a monthly board pack.
How does Power BI connect with Business Central?
Business Central provides native integration with Microsoft Power BI.
Because both are part of the Microsoft ecosystem, users can access Power BI analytics from within Business Central itself as well as through the Power BI service.
This means the reporting experience can be delivered in several different ways.
Someone working primarily in Business Central may want relevant dashboards available directly from their Role Centre or from the pages they already use.
A finance director or senior manager may prefer to consume reports directly through Power BI.
Other people may want information shared through Microsoft Teams, email links, SharePoint or presentations.
The technology therefore doesn't dictate how everybody has to consume the information.
The reporting can be delivered in the way that best suits the role of the person using it.
Can Power BI reports appear inside Business Central?
Yes.
One of the major benefits of the integration is that users don't necessarily need to leave Business Central to consume Power BI information.
Reports can be made available from Business Central Role Centres and relevant pages.
That can make adoption significantly easier because employees aren't being asked to learn an entirely separate reporting environment before they can access useful information.
If someone is already working within Business Central, their relevant analytics can sit alongside the operational information they're using every day.
At the same time, users who prefer the fuller Power BI experience can open those same reports directly within Power BI.
It's the same underlying information presented in the environment that makes the most sense for that user.
What financial information can you analyse with Power BI and Business Central?
Finance is one of the most obvious areas where Power BI can add value.
Imagine it's Monday morning and a CFO wants an immediate overview of business performance.
Rather than asking the finance team to produce several reports, they could open a financial dashboard containing measures such as total revenue, margin, cash position and liquidity.
The dashboard can highlight the metrics that matter most and then allow the user to move into more detail where necessary.
Income statements, balance-sheet information, year-on-year comparisons and measures such as EBITDA can all form part of the wider reporting experience.
The value comes from combining the overview with the ability to investigate.
A management team might see that revenue has changed from the previous year.
Rather than stopping at that number, users can drill into it and understand which transactions, customers or areas of the business contributed to the change.
That moves the conversation from:
"What is the number?"
to:
"Why is the number changing?"
And that's where business intelligence becomes considerably more useful than simply presenting a static report.
Can you filter and interrogate Power BI reports?
Power BI dashboards aren't fixed reports.
Users can interact with them.
For example, a report may initially show the current financial year, but a user could change the date range to look at historical performance.
They could compare different periods, select particular business areas or filter information according to the questions they're trying to answer.
Views can also be adjusted depending on the situation.
If somebody is presenting at a meeting, they may want a clean set of headline KPIs.
If they're investigating an issue, they may want considerably more detail.
The same underlying data can support both.
That flexibility is particularly useful because different people rarely need exactly the same view of an organisation.
A board member may want a high-level overview.
A financial controller may want transaction-level detail.
An operations manager may only care about the KPIs relating to their area.
Power BI allows those different reporting needs to be addressed without creating entirely separate information silos.
Can you drill from Power BI into the transactions in Business Central?
For Business Central users, Power BI can provide links back into the underlying data.
That means someone looking at a total in a report isn't necessarily restricted to the visualisation they're seeing.
If they need to understand what makes up the figure, they can move from the summary information towards the underlying transactions within Business Central.
For example, a user could see a revenue figure and then investigate the individual invoices or transactions contributing to that total.
This is particularly useful because management reporting often generates further questions.
A dashboard might tell you where something has changed.
The Business Central data underneath it helps tell you why.
Power BI cash flow and liquidity reporting
Cash visibility is another good example of where dashboards can simplify reporting.
Rather than running separate reports to calculate or compare liquidity measures, businesses can display relevant KPIs together.
That might include measures such as cash ratio, current ratio or other indicators that the organisation considers important.
A dashboard can then act as a management tool.
Instead of hunting for information, the user can immediately see which areas may need attention.
That doesn't remove the need for financial analysis.
It simply makes the information required for that analysis much easier to access.
For many organisations, one dashboard may answer the majority of the routine questions management teams ask every month.
Sales reporting in Power BI for Business Central
Power BI reporting isn't limited to finance.
Business Central contains information covering sales, customers, opportunities, stock, projects and wider operational activity.
That gives businesses the opportunity to use the same reporting principles across the organisation.
A sales dashboard might show information about an organisation's highest-value customers, sales trends, salesperson performance or opportunities currently in the pipeline.
A sales manager could quickly identify their largest customers and then examine what products those customers are buying most frequently.
They could review performance by salesperson and compare actual results against expectations.
They might also use pipeline information during one-to-one meetings with salespeople to understand which opportunities are progressing and where action may be needed.
Once again, the objective isn't simply to create another report.
It's to put useful information in front of people at the point they need to make a decision.
Actual versus budget reporting
Businesses can also use Power BI to compare actual performance with budget or forecast information.
This might include sales performance, financial results or other operational measures.
Variance calculations can then make it easier to see where actual results are moving away from expectations.
Rather than discovering that variance weeks later during month-end reporting, managers can have much greater visibility while there is still time to respond.
The same dashboards can also show performance over time, helping businesses understand whether a difference represents a one-off event or a wider trend.
Forecasting with Business Central and Power BI
Reporting tells you where you are.
Forecasting helps you understand where you may be heading.
By combining current performance with expected future activity, Power BI can support conversations about sales forecasts, operational requirements and financial expectations.
That gives operations teams and sales teams a shared view of both current activity and what's expected in future.
This can be particularly valuable where decisions in one area have consequences elsewhere.
For example, a stronger sales forecast may affect inventory planning.
An expected project may influence resource requirements.
Changing financial performance may affect purchasing or cash planning.
Bringing those views together allows management teams to make decisions with a broader understanding of what's happening across the organisation.
Inventory reporting in Power BI
Inventory is another area where Power BI can make Business Central data easier to consume.
An inventory dashboard could provide a snapshot of stock across locations and answer questions such as:
What inventory do we currently have?
Where is it located?
What stock are we expecting to receive?
How quickly are products being consumed?
Are items available for a particular customer or project?
A user could filter stock by warehouse or location and use that information to consider whether inventory should be moved elsewhere in the business.
That information may be useful to warehouse teams, customer service staff, project managers and senior management.
Someone may not need complete Business Central access simply to understand whether stock is available.
Appropriate Power BI reporting can give them the information they need without requiring them to work directly within the ERP environment.
Can people without a Business Central licence view the information?
Depending on how your Microsoft environment and licensing are configured, Power BI can allow information to be consumed by people who don't work directly within Business Central.
This can be particularly valuable for employees who need insight but don't need to process transactions.
For example, somebody may need to know whether stock is available but have no requirement to create sales orders, purchase orders or inventory transactions.
Power BI gives organisations another way of distributing useful management information to the appropriate audience.
Access still needs to be controlled correctly, but that separation between consuming information and processing ERP transactions can make reporting far more widely useful.
Project reporting with Power BI
Projects can also be incorporated into the reporting environment.
Businesses can analyse project performance alongside financial and operational information, rather than treating projects as an entirely separate reporting exercise.
That can help managers understand areas such as project progress, actual costs, expected costs and wider financial performance.
It also means project teams and finance teams can work from a more consistent view of the organisation.
Instead of extracting data and rebuilding reports manually for each meeting, relevant dashboards can remain available and be refreshed as the underlying information changes.
Sustainability reporting in Business Central and Power BI
Sustainability is becoming another increasingly important source of business information.
Business Central can capture sustainability-related data, which can then be surfaced through Power BI dashboards.
That could include information connected with emissions, stock movements, purchased goods, suppliers and other operational activity.
The significance of this isn't limited to businesses facing a specific reporting requirement today.
More organisations are being asked for sustainability information by customers, larger organisations within their supply chain, certification bodies and other stakeholders.
Power BI provides a way of taking the underlying information and making it easier to monitor and communicate.
For example, an organisation may want to track CO2 emissions against a baseline or understand emissions across different categories.
A dashboard can provide that visibility alongside the broader information already being captured within Business Central.
Can Power BI be used for ESG and workforce reporting?
Power BI can also bring together information beyond traditional financial and operational measures.
Depending on the information available to the organisation, dashboards could include elements of social and governance reporting.
That might include workforce metrics, age distributions or other information businesses choose to monitor and publish.
The wider point is that Power BI doesn't have to be thought of solely as a finance-reporting tool.
It is a platform for analysing business information.
If reliable data exists and the organisation has an appropriate reason to analyse it, Power BI can often provide a way of making that information easier to understand.
How can Power BI reports be shared?
One of Power BI's strengths is the number of ways users can consume and share information.
Reports can be accessed directly through Power BI or, where appropriately configured, surfaced through Business Central.
They can also form part of the wider Microsoft 365 environment.
For example, a report might be shared with colleagues through Teams or incorporated within SharePoint.
Information can also be exported for further analysis where necessary, including into tools such as Excel.
For board or management meetings, Power BI content can be incorporated into PowerPoint.
That means people can discuss the figures during a presentation while still retaining access to interactive information rather than relying entirely on screenshots prepared days beforehand.
The important thing is that the business can choose the way people consume the information rather than forcing every audience into the same reporting method.
Can Power BI reports in PowerPoint stay interactive?
Power BI can be particularly useful when reports are required for meetings.
Rather than simply pasting a static chart into a presentation, Power BI content can be incorporated in a way that allows users to continue interacting with the information.
If somebody asks a question during the meeting, users can potentially filter or investigate the figures rather than making a note to run another report later.
Reports can also be refreshed before the meeting so the latest available information is displayed.
For organisations used to manually rebuilding monthly presentations, this can significantly change the way management reporting is prepared and consumed.
How secure is Power BI reporting from Business Central?
Reporting should never mean giving everybody unrestricted access to all company information.
Security and governance therefore play a major role in any Power BI implementation.
Business Central and Power BI sit within the wider Microsoft platform, including Microsoft Entra ID.
This means organisations can align user access with the security structures they're already using.
Power BI can also use row-level security, which allows organisations to restrict which information particular users can see.
Someone may have access to a dashboard without being able to see every company, department, region or data set within it.
This is particularly important where reports contain sensitive financial or commercially confidential information.
The objective is to give people the insight they need without unnecessarily exposing data they don't.
Can Power BI access data outside Business Central?
Yes.
Although Business Central may be the core source of operational or financial information, many organisations hold important data in other systems.
Power BI can form part of a wider reporting architecture that combines information from multiple sources.
For some organisations, Microsoft Fabric or Dataverse may form part of that architecture.
This can be useful where businesses have third-party applications or databases that they want to analyse alongside Business Central information.
Rather than building completely separate reporting environments for each system, organisations can create a wider data and analytics strategy.
How sophisticated that architecture needs to be depends entirely on the organisation.
For some businesses, connecting Business Central directly with Power BI may be sufficient.
For others, a broader data platform may make sense.
Can Power BI send alerts when something changes?
Dashboards are useful when someone actively looks at them.
But Power BI can also help users respond when particular measures change.
Alerts and monitoring can be used around important KPIs.
For example, an organisation might want to know when CO2 emissions move above a particular baseline.
Another business may want to monitor a financial or operational threshold.
Rather than somebody repeatedly opening a report and checking the number, the system can help alert users when the relevant condition occurs.
Depending on the configuration, notifications can be incorporated into the wider Microsoft environment, including tools such as Teams and email.
This turns reporting into something more proactive.
Instead of asking:
"Has something changed?"
the system can help tell you:
"Something has changed — this may need your attention."
Can Power BI provide automatic insights?
Power BI also includes functionality designed to help users investigate their data.
Users can ask questions of the information, explore insights and identify patterns without manually recreating every possible report.
This is another reason to think of Power BI as more than a dashboarding tool.
The longer-term goal is to make business information easier to explore.
For organisations that have historically relied heavily on specialist report writers or repeated spreadsheet manipulation, that can reduce the distance between somebody asking a question and getting an answer.
Do you have to build every Power BI report from scratch?
No.
And this is one of the most important points from our webinar.
Many businesses assume that introducing Power BI means starting with a blank screen and commissioning a large bespoke reporting project.
It doesn't necessarily have to.
There are Power BI apps and reporting packs available that provide pre-built dashboards for common Business Central requirements.
These can cover areas such as finance, sales, inventory, projects, manufacturing and sustainability.
Rather than spending significant amounts of time designing every KPI and visual from the ground up, businesses can begin with proven reports and configure them around their requirements.
This can make Power BI much more accessible to organisations that want better reporting but don't want to undertake a large business-intelligence project.
What are Power BI reporting packs?
A Power BI reporting pack for Business Central is a pre-built collection of dashboards and reports designed around common Business Central data.
Instead of creating the complete data model, measures, reports and visualisations from scratch, organisations have a starting point that already addresses many common reporting requirements.
The exact information available depends on the pack being used, but it may include financial reporting, sales, inventory, projects, manufacturing and sustainability.
The advantage isn't simply implementation speed.
Pre-built reporting also helps organisations answer an important question:
What should we actually be measuring?
Businesses often know they want better reporting but aren't always sure how to translate that ambition into a finished dashboard.
A reporting pack provides a practical starting point that can then be adapted where required.
Power BI packs vs bespoke Power BI reporting
There isn't necessarily a choice between completely standard reporting and a completely bespoke development.
For many businesses, the best approach sits somewhere between the two.
A pre-built Power BI pack can provide the majority of the information the organisation needs.
Additional reports, KPIs or modifications can then be introduced where they provide genuine value.
That is usually considerably more efficient than recreating standard financial, sales and inventory reporting from scratch.
Steph described this in the webinar as potentially addressing a large proportion of the typical reporting requirement before additional configuration is considered.
The remaining work can then focus on the information that is genuinely unique to the business.
Why Business Central should remain your source of truth
Throughout the webinar, one theme runs through almost every example.
Business Central should provide the trusted operational information.
Power BI shouldn't become another place where people manually maintain figures.
Its role is to help users understand the information that already exists.
That distinction matters.
If teams start altering figures independently within reporting tools or creating their own disconnected versions of the truth, many of the original reporting problems return.
By keeping the core business information within Business Central and using Power BI to analyse it, organisations can retain stronger control and consistency.
Everyone can work from the same underlying information while consuming it in ways that suit their role.
That is ultimately what good business intelligence should deliver.
Moving from reporting to better decision-making
It can be tempting to judge a reporting project by the number of dashboards it creates.
But that's not really the objective.
The measure of success is whether people are able to make better decisions.
Can a finance director understand profitability more quickly?
Can a sales manager identify changes in customer behaviour?
Can an operations team see where stock availability may become a problem?
Can management compare actual performance with budget without waiting for another spreadsheet?
Can the business spot changes that require attention earlier?
If the answer to those questions improves, then the reporting is doing its job.
Power BI takes the operational truth held inside Business Central and makes that information easier for people throughout the organisation to consume.
And because it's part of Microsoft's wider ecosystem, that insight can increasingly be brought into the tools people already use every day.
Get more from the data already in Business Central
For most businesses, the reporting challenge isn't that they don't have enough data.
It's getting useful information in front of the right people quickly enough to make a difference.
If your teams are still repeatedly exporting Business Central data into spreadsheets, manually compiling monthly management reports or struggling to give different departments a consistent view of performance, Power BI may be worth exploring.
At The HBP Group, we can help you understand the Power BI reporting already available around Business Central, identify the dashboards most relevant to your organisation and introduce reporting packs without unnecessarily rebuilding everything from scratch.
Speak to The HBP Group about Power BI reporting for Business Central.

Posted by Steph Pearson
Steph has progressed through a range of roles across The HBP Group, including Customer Liaison and Senior Solutions Consultant, building deep hands-on knowledge across ERP, EPOS systems design, customer support, and implementation. She also holds an NVQ4 in AAT Accountancy.
On the blog, Steph writes about ERP, business process improvement, and how organisations can use technology to streamline operations and make better decisions with confidence.

.png?width=100&name=HBP%20Gradient%20Bar%20(210mm).png)

 info@thehbpgroup.co.uk
 01482 423910


.png?width=2484&height=10&name=HBP%20Gradient%20Bar%20(210mm).png)